live visuals, Tom Luyten and OSC
Tom Luyten
Watching a whole show by a guy playing the double bass is likely to be a little bit boring, visually speaking at least. Right from the beginning I had the idea to combine and control visual elements with my setup.
The whole programming of the setup itself took so much time that I realised at an early stage that I won’t be able to do this on my own. Luckily, I met Tom Luyten, a visual artist and teacher at the ZUYD University of Applied Science.
I told him about my ideas and he agreed to work with me for my graduation concert.
I am beyond happy that he will be part of the show.

Concept
I imagined visuals, which are generated by my audio signals. I have them as separate files in my computer.
Tom works in the field of computer generated art. But to generate art, you need data. I thought of ways of how I could provide him data out of my setup with which he could work.
data sources
These qre possible data of audio:
- Note pitch
- Velocity
- Frequency spectrum
OSC
I talked about OSC earlier, it is stable, easy to use and I have it integrated in my setup.
Transformation audio into data
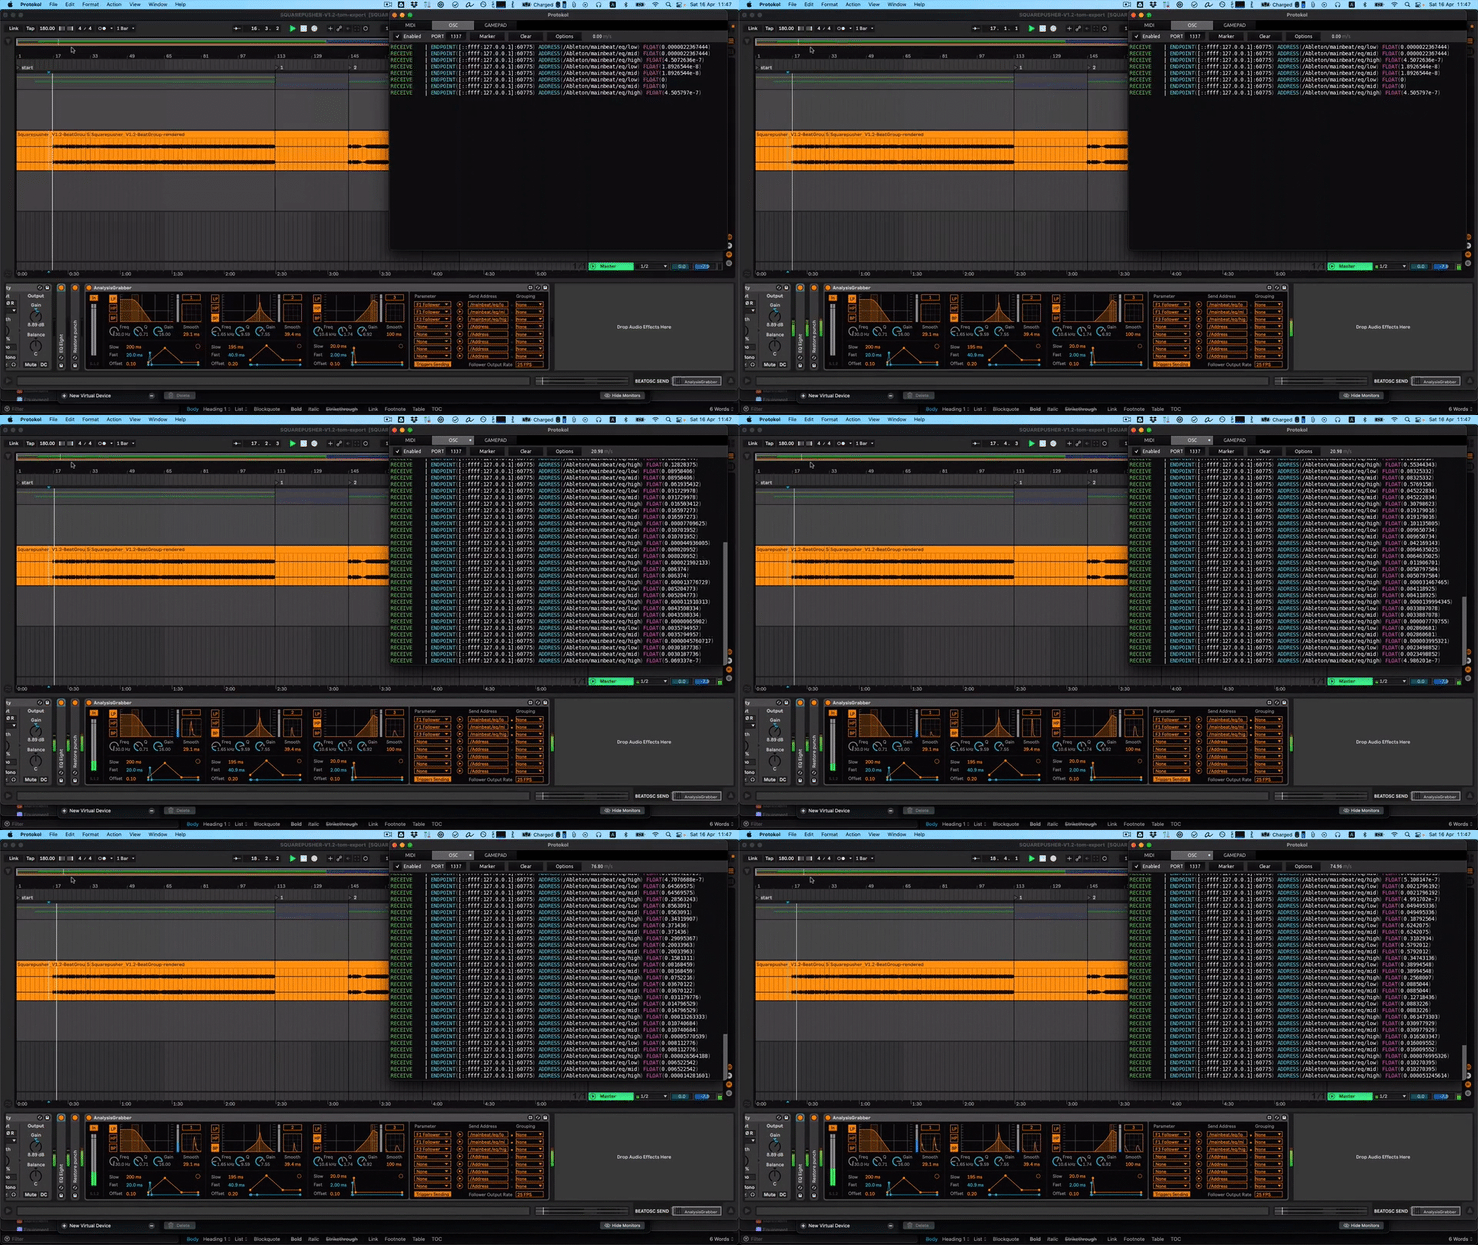
I found plugins from showsync which are free and analyse audio data and transform them into OSC. Like an EQ where you can analyse the frequency spectrum and generate OSC data.

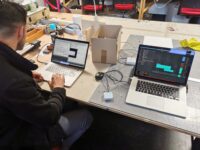
This can be send over WIFI to Tom and he will feed this data into his system to generate visuals. We had a recent test to see if it works and it did right away!
yipiie.


